
04 · Observe
See it live. Fix it in the browser.
Metrics, logs, events and a terminal for every app, without kubectl, a VPN or the cloud console.
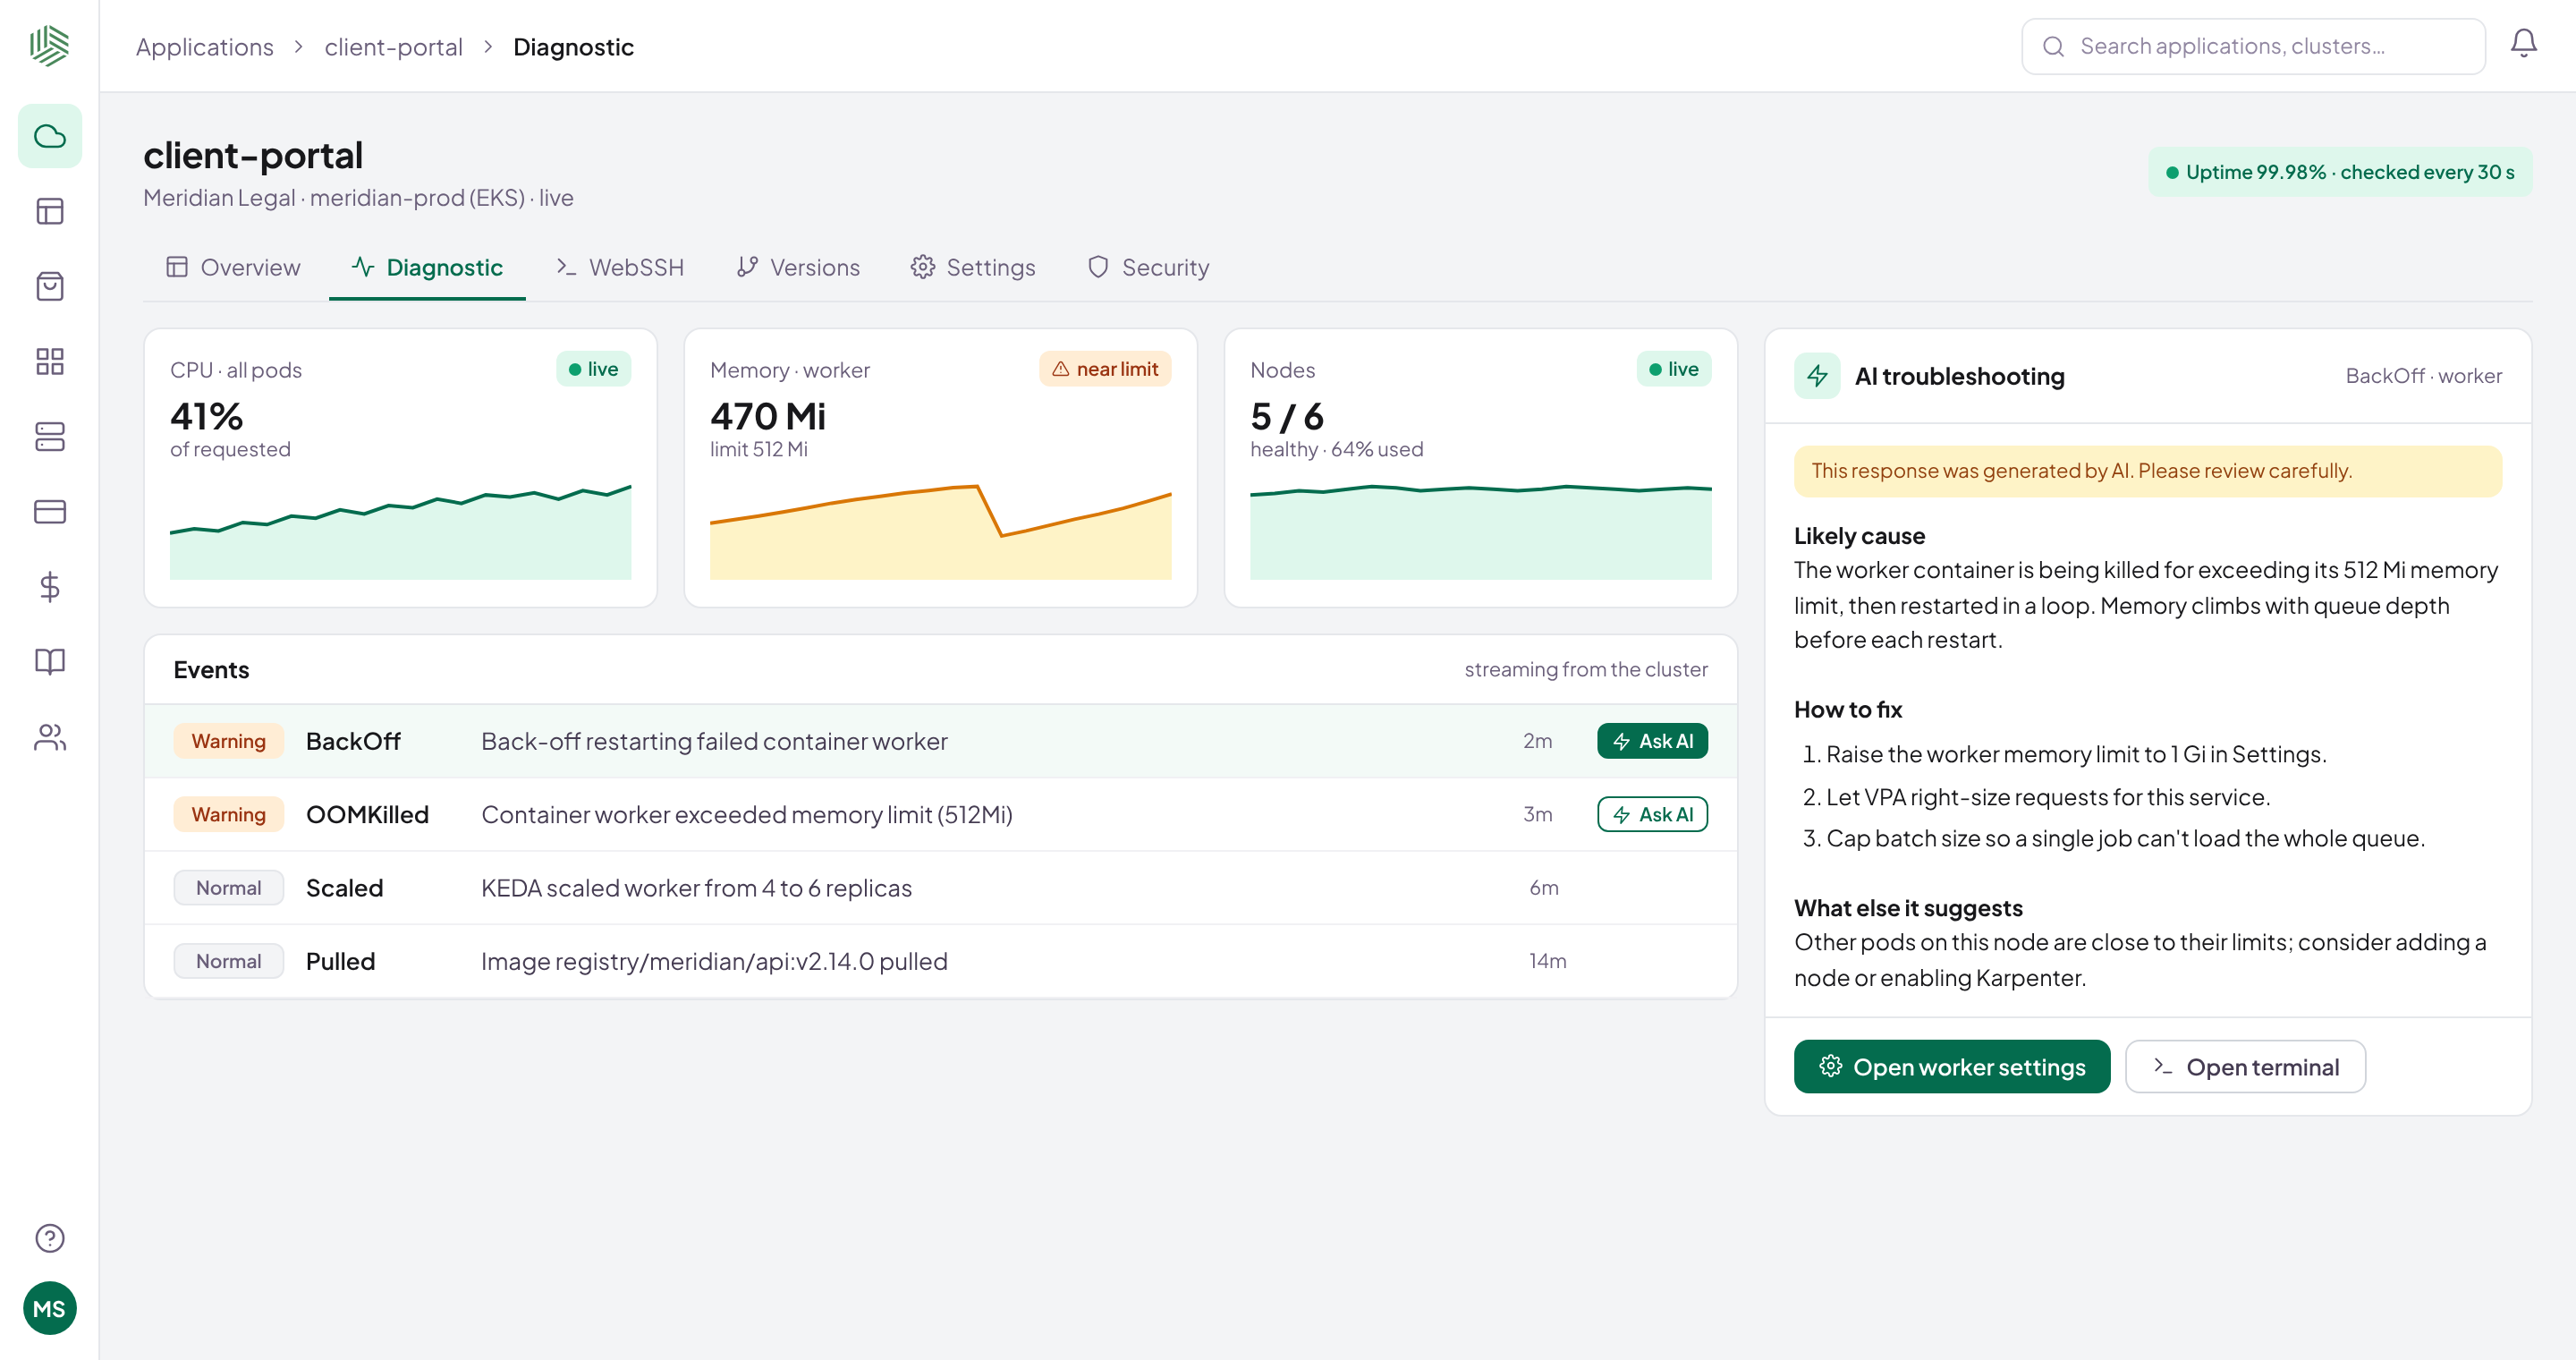
Real Shipfast screen · sample data
Events and AI
Every warning, with its fix.
Events stream in live. Click Ask AI on any warning.
- The likely cause and what to change
- Written for your role
- Marked as AI-generated
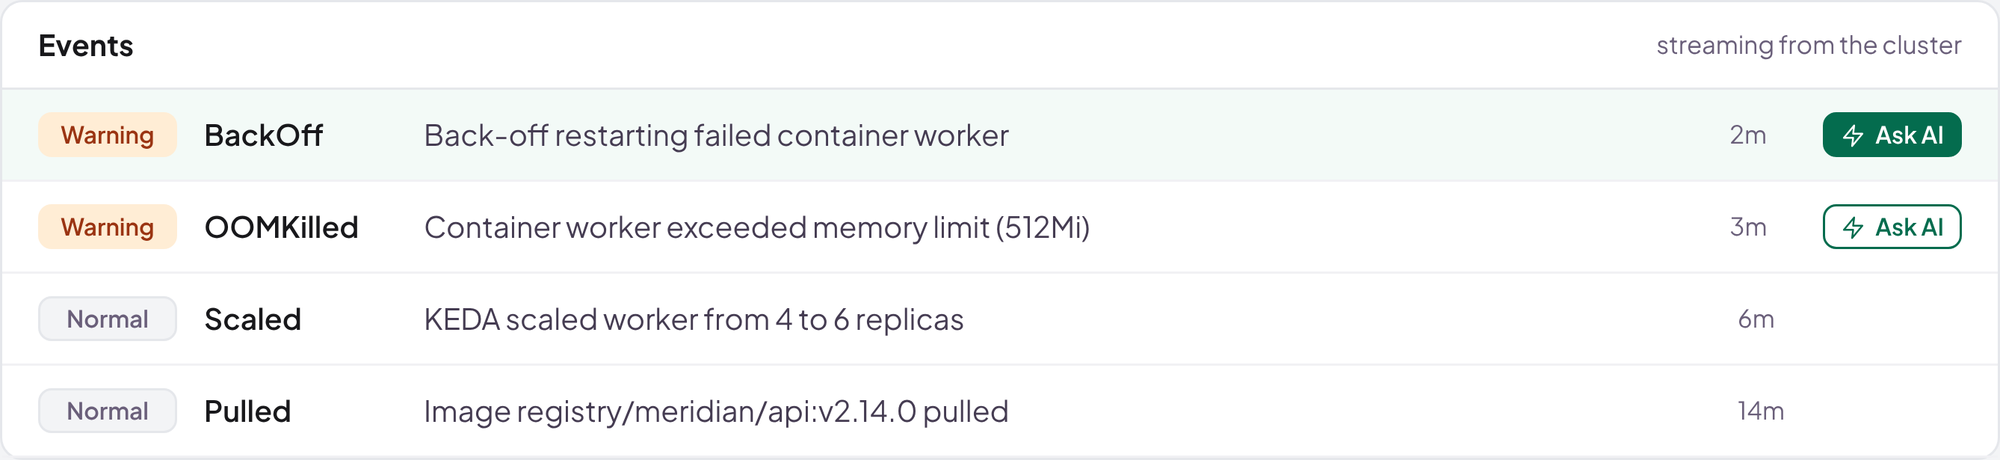
Real Shipfast screen · sample data
Metrics and logs
Pods, nodes and logs in one place.
Everything kubectl would show, in the browser.
- Pod CPU and memory every 20 seconds
- Live logs with warnings highlighted
- A terminal into any pod
# Browser terminal · worker · meridian-prod
/app $ ps aux --sort=-%mem | head -3
USER   PID %CPU %MEM COMMAND
app      1 38.0 97.4 node worker.js
/app $ cat /sys/fs/cgroup/memory.max
536870912   # 512Mi limit
IllustrativeNo kubectl, VPN or cloud console
Uptime
Know it is down before your users do.
HTTP checks every 30 seconds, with alerts.
- Response times kept for every check
- Alerts when a site stops responding
- KEDA, VPA and Karpenter managed for you
Uptime checksevery 30 s
portal.meridianlegal.comup182 ms
api.brightsmile.healthup140 ms
shop.larkspur.codown 2 minAlert sent
staging.larkspur.coup210 ms
IllustrativeSample checks
How it works
From warning to fixed.
See itA warning or a spike, live.
Ask AIThe likely cause and the fix.
Look closerLogs, metrics or a terminal.
Fix and confirmWatch it recover.
FAQ
Questions, answered.
Do developers need kubectl access?
No. Logs, metrics, events and a terminal are all in the browser, controlled by roles.
How often are metrics collected?
Pod CPU and memory every 20 seconds; uptime checks every 30 seconds.
Does it work for apps on VMs?
Yes. Apps on VMs get the same releases, logs and alerts as apps on Kubernetes.
Is the AI answer always right?
Not always. Every answer is marked as AI-generated so people review it before acting.
Now onboarding pilot teams
Ready to ship faster?
Bring one app. We'll connect a cluster and ship a release with you.