
For SREs
Every signal, and what to do about it.
Metrics, events, uptime and logs for every cluster, with a fix next to each warning.
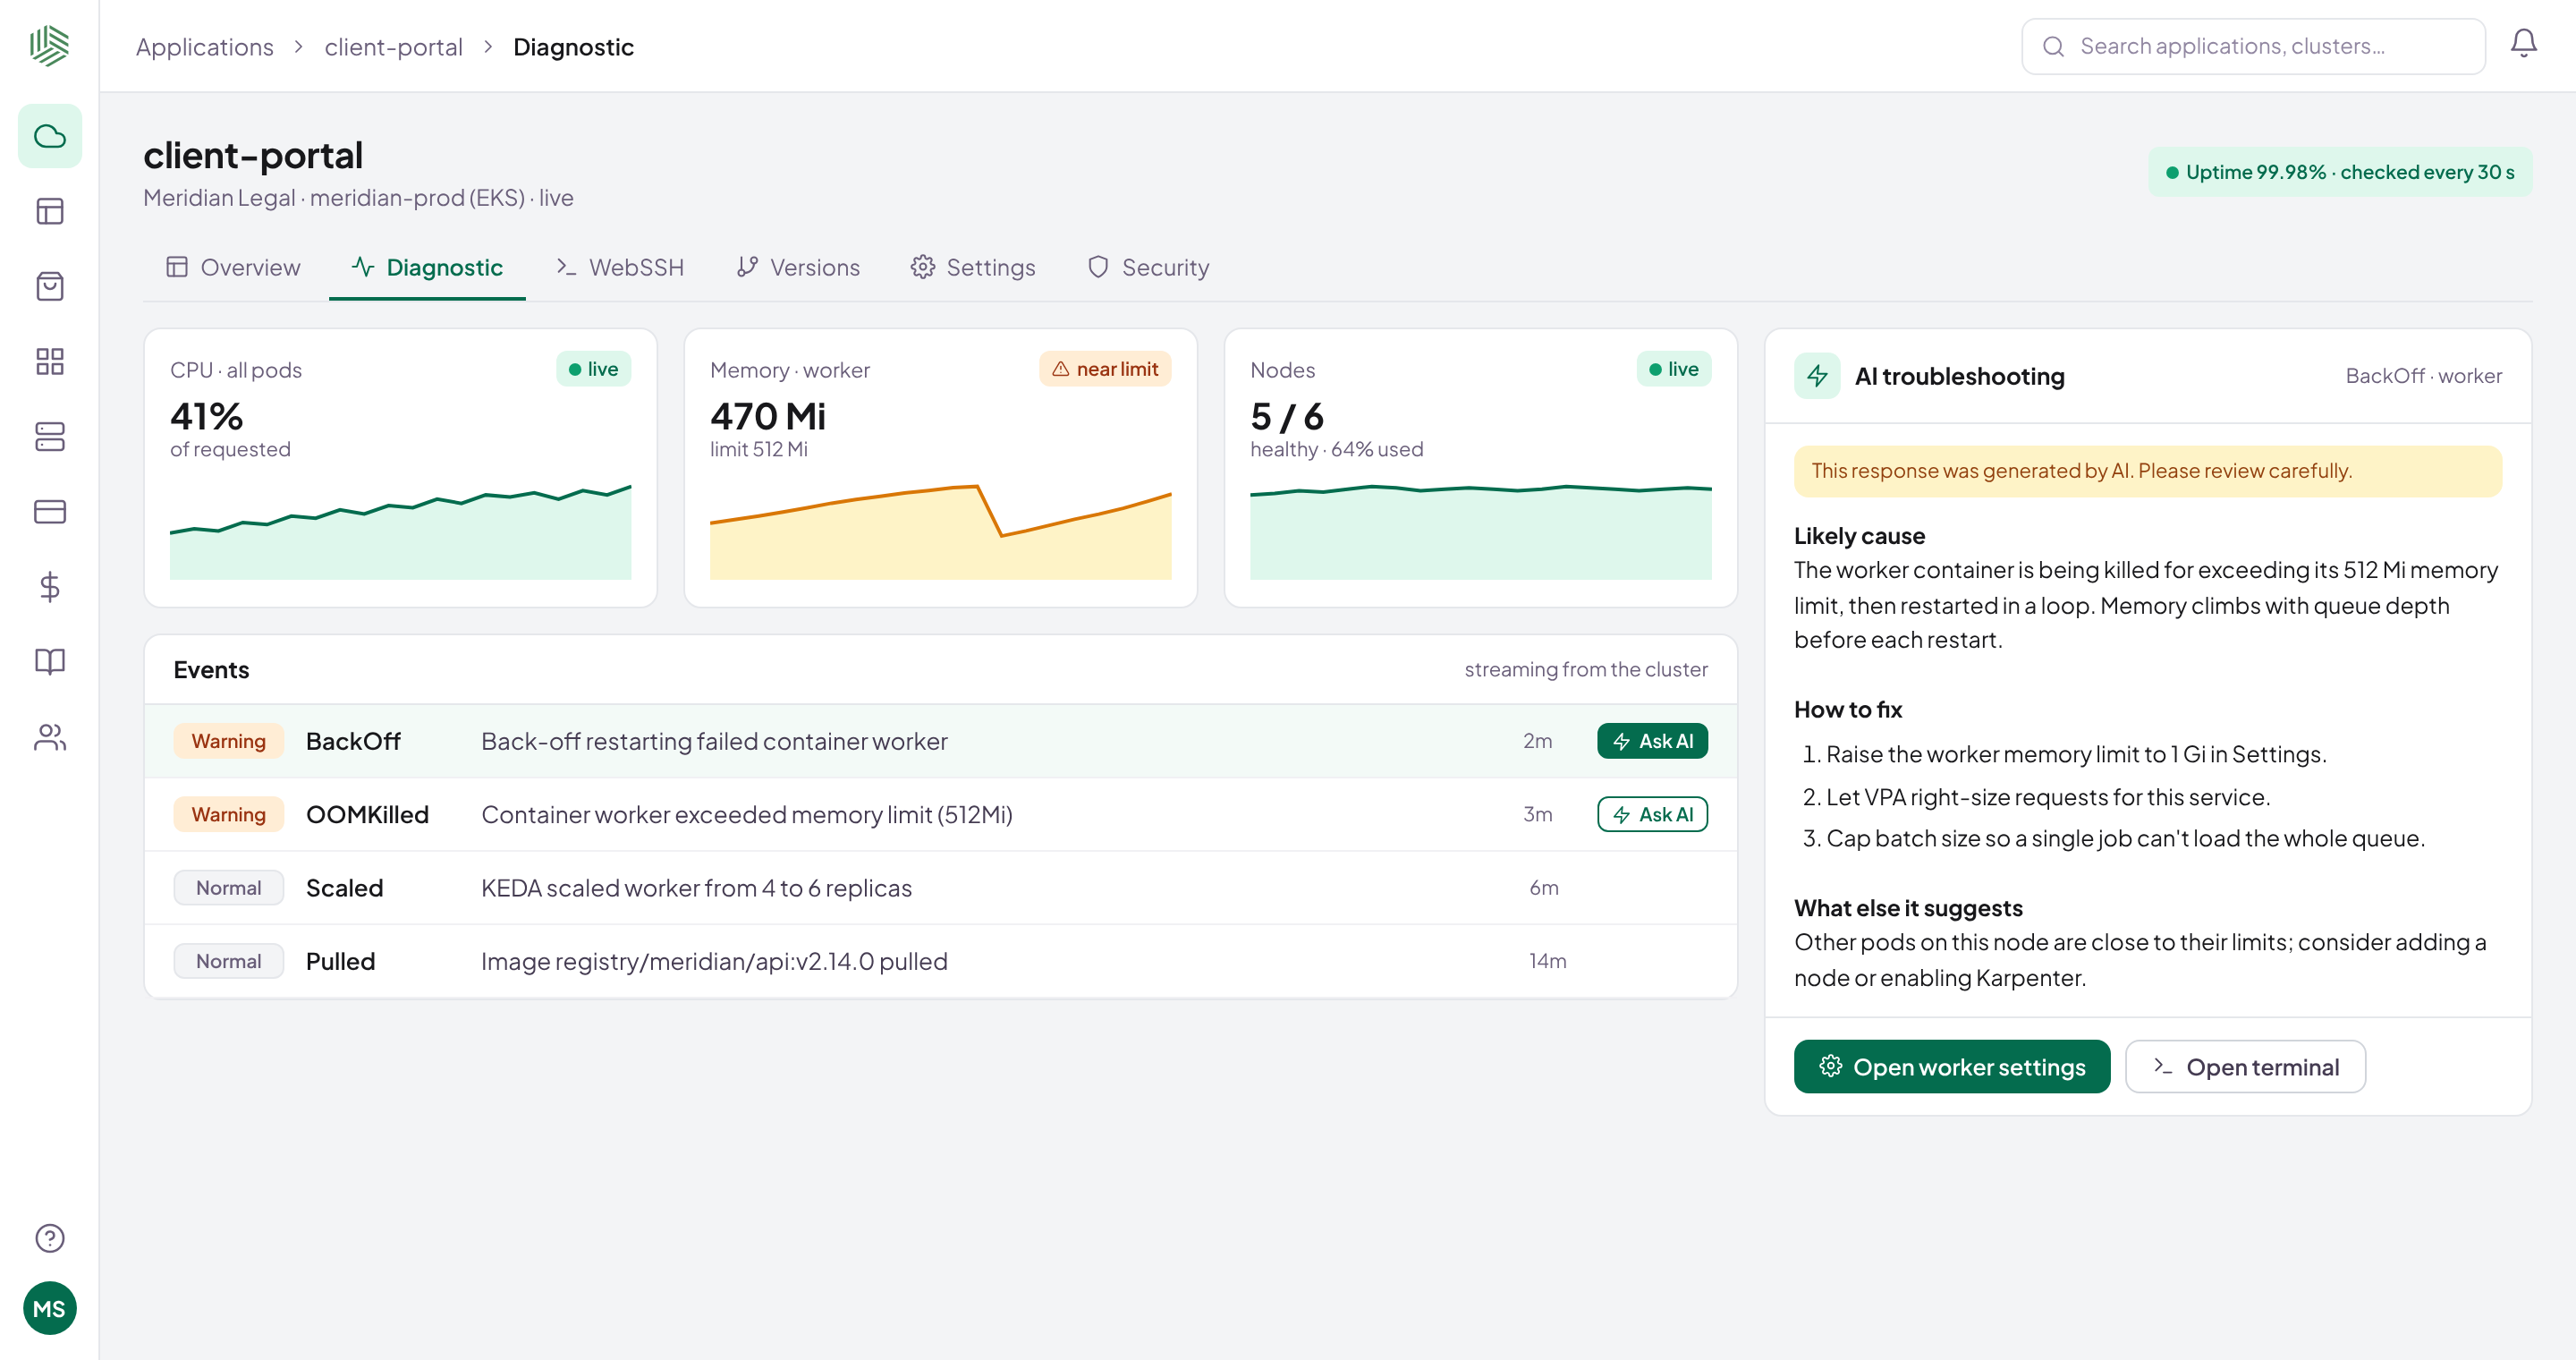
Real Shipfast screen · sample data
Sound familiar?
Too many consoles, not enough answers.
Signals in five placesA console per cloud.
Alerts without contextEvery investigation starts at zero.
Capacity by guessworkNodes fill up quietly.
Events and AI
From warning to fix, faster.
Ask AI reads the related events, logs and metrics.
- Events from every cluster, live
- The likely cause and the change
- People decide what to apply
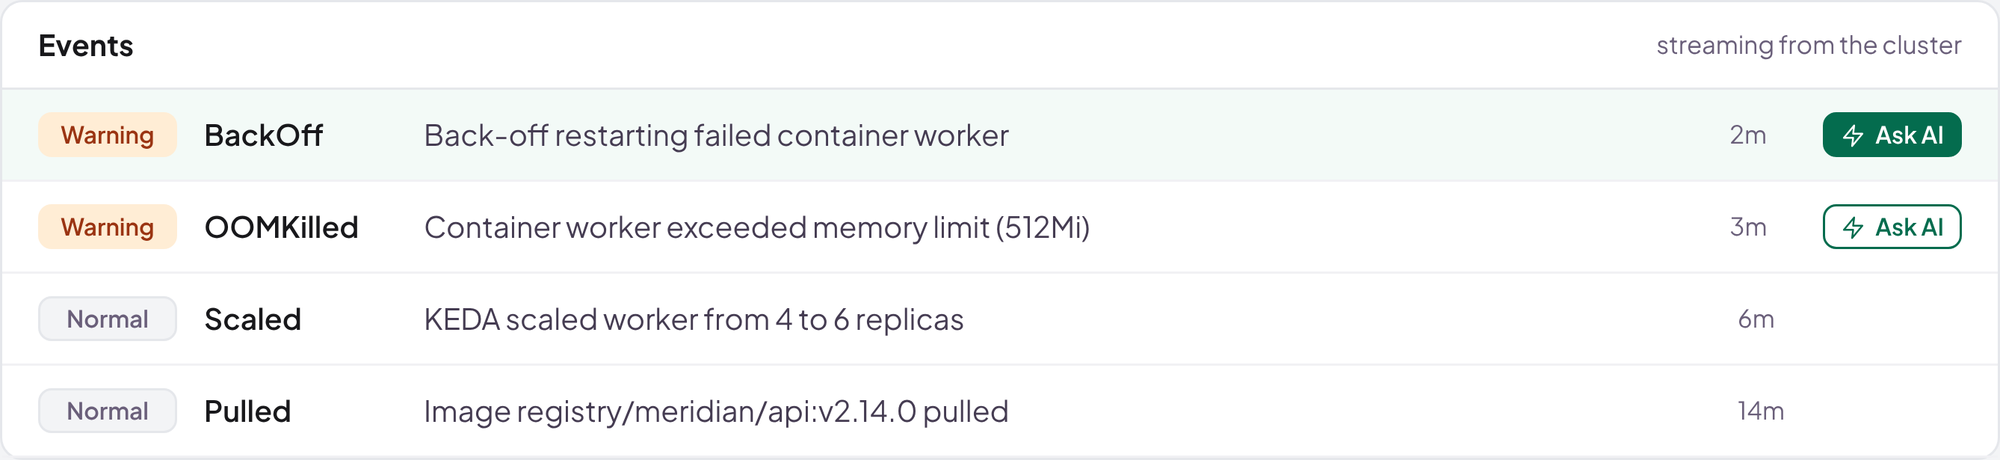
Real Shipfast screen · sample data
Health
Metrics and uptime, everywhere.
Metrics and uptime across every cluster.
- Pod metrics every 20 seconds
- Uptime checks every 30 seconds
- Alerts on downtime
Uptime checksevery 30 s
portal.meridianlegal.comup182 ms
api.brightsmile.healthup140 ms
shop.larkspur.codown 2 minAlert sent
staging.larkspur.coup210 ms
IllustrativeSample checks
Scaling
Autoscaling, already wired up.
KEDA, VPA and Karpenter, installed and managed.
- Scale-to-zero for quiet workers
- Right-sized requests
- Nodes added when needed
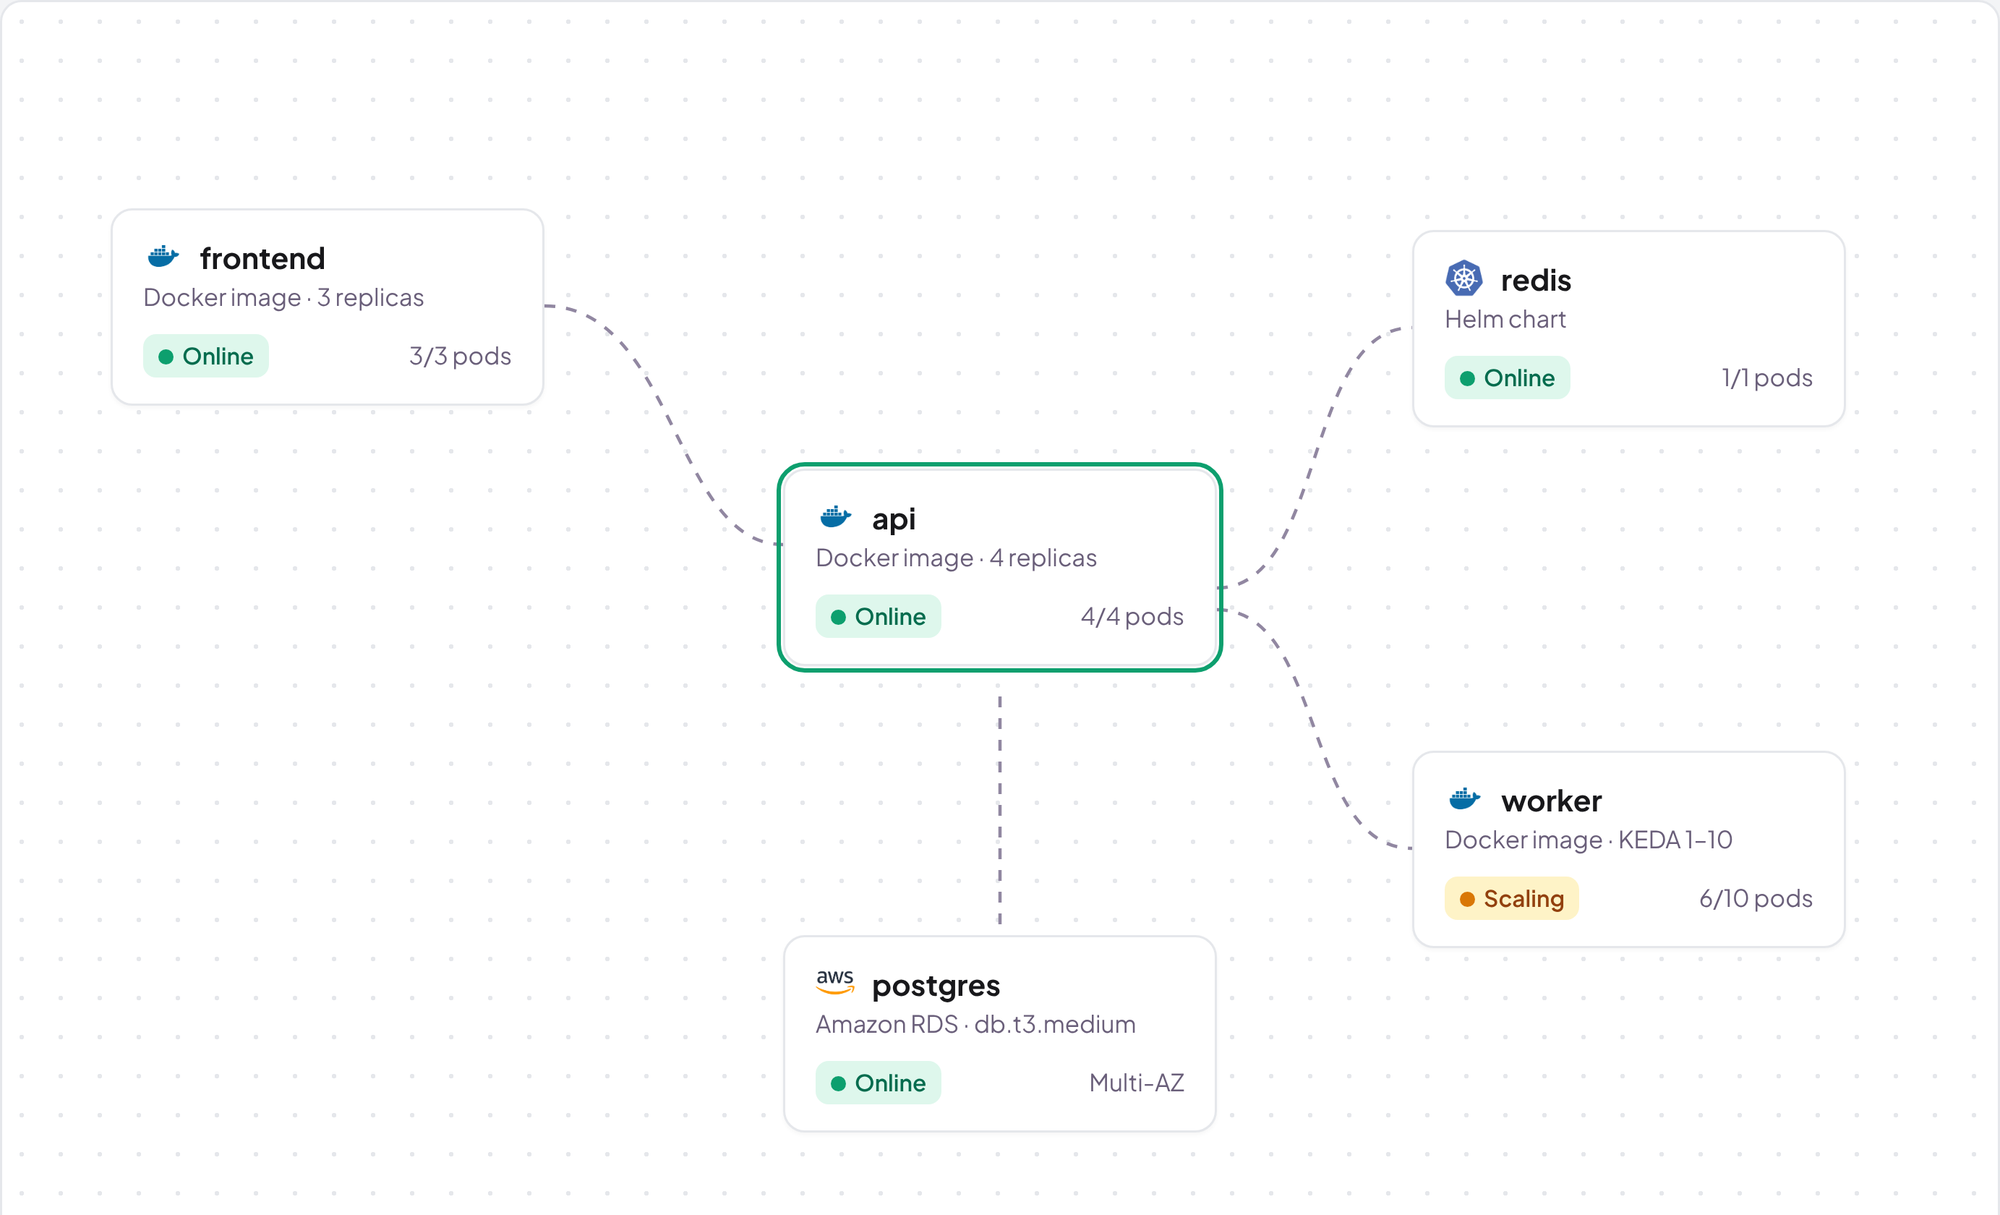
Real Shipfast screen · sample data
What changes
Same people. Less toil.
Investigate an incident
BeforeConsole, VPN, kubectlAfterEvent, AI answer, logs in one place
Know a site is down
BeforeA customer tells youAfterUptime check alerts in 30 seconds
Scale a worker
BeforeEdit YAML by handAfterKEDA and VPA managed for you
FAQ
Questions, answered.
Which clusters can I monitor?
Every cluster Shipfast creates or connects, on any cloud or on-prem.
How often is data collected?
Pod metrics every 20 seconds, uptime checks every 30 seconds.
Does the AI change anything by itself?
No. It suggests; a person with the right role makes the change.
Can we keep our existing monitoring?
Yes. Shipfast does not replace tools you already rely on.
Now onboarding pilot teams
Ready to ship faster?
Bring one app. We'll connect a cluster and ship a release with you.